Who Blinks First? The Expectations Gap Between Buyers and Sellers

MSCI
Real Assets Research

MSCI
Real Assets Research

MSCI
Real Assets Research

MSCI
Real Assets Research
Where have all the deals gone? Fewer transactions have closed in 2023 than in 2021 and 2022 because market participants have different expectations about the worth of assets.
Current owners want the prices they could have achieved a year ago, and potential buyers want to underwrite every worst-case scenario before pursuing an investment. Price discovery is a slow process, and analyzing the market is difficult when deals are scarce.
Information is available, however. The pain in the REIT market was felt quickly when interest rates increased in 2022, for instance, when share prices of those companies fell. Granted, share prices for companies may not always translate into property pricing. Other information is present, though, including the motivations that potential buyers and sellers face that can define how the gap in price expectations will be closed. If deal volume is low because prices are too high for buyers to jump into the market, flip that concept around and ask how much prices would need to adjust to bring deal volume back to normal levels.
The Scope of Illiquidity
One billion dollars does not go as far as it used to. In 2005, that much capital bought 5.6 million square feet of US office space, but at the end of 2022, the same amount bought only 4.2 million square feet. Shrinkflation is at work even in the commercial real estate industry. Understanding normal levels of deal activity for the sector can be complicated by this inflationary trend.
Sticking with the office example, deal volume in 3Q2023 stood at $10.6 billion. This level was 61% lower than the average Q3 pace of $27.3 billion seen from 2005 to 2019. In terms of square feet traded, illiquidity was down a bit less, a 57% drop from previous Q3 averages at only $54.3 million per square feet traded. Controlling for inflation, though, the value of capital committed to the office market in Q3 of this year was 71% lower than the Q3 average seen in the years before the COVID-19 pandemic.
Controlling for that inflationary trend, US investment activity is well below average levels in 2023 for all sectors except industrial. The scope of the illiquidity in the market is highlighted in Exhibit 1, with every dot representing a property sector and those below the yellow line at a below-average level of deal volume in 3Q2023. Some sectors faced higher degrees of illiquidity.
The central business district (CBD) office market is in the worst position. Deal volume in 3Q2023 stood at $1.8 billion. This level of deal activity was 88% lower than the average inflation-adjusted pace set in every Q3 period from 2005 to 2019. Suburban offices are in a better state—but barely. Deal volume was 58% lower on an inflation-adjusted basis than previous Q3 averages.
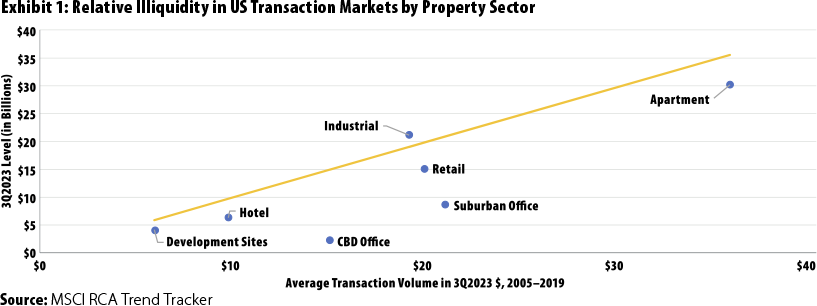
Deal volume for the apartment sector stood at $30.1 billion in 3Q2023. This level was 15% lower than the long-run Q3 average of $35.5 billion in 2023 dollars. This sector is still popular with many institutional investors because of features such as a low capex burden relative to net operating income (NOI), more predictability around the demographic drivers of demand than for sectors driven by business cycle drivers, and lower costs of financing thanks to the government-sponsored enterprises. Despite these and other attractive features of the sector, illiquidity is still an issue the sector faces following the shocks to the interest rate environment since 2022.
At What Price a Buyer?
Deal volume is low relative to history for most sectors, but at what point will capital jump in from the sidelines to pursue real estate investments? To motivate this capital, prices need to move enough to reflect the reality of prevailing income growth expectations. The income growth investors expect today and how it varies from past cycles shows a divergence across property sectors in line with the differences in sales volume.
There is a divergence between current and expected income growth moving forward, with some sectors still working through challenges from the initial shocks to the market following the pandemic shutdowns in 2020. Current NOI growth by property sector is highlighted in Exhibit 2, drawing on the figures tallied in the MSCI US Quarterly Property Index. The retail and apartment sectors faced the worst initial shocks to income from the pandemic—facing 23.7% and 12.7% year-over-year declines in NOI in 1Q2021 and 2Q2021, respectively. Performance in these sectors is drawn more from the consumer side of the economy, and with households slammed in 2020 and patterns of household spending changing, income growth for these asset classes plummeted. The transaction market suggested that this direction was where income was headed.
Transaction markets reflected the bottom of the path for income growth a quarter or two ahead of the appraisal-based measures. The yellow lines in the chart are constructed using the RCA Hedonic Series for cap rates and pricing and can be interpreted as the amount of growth in current transaction prices that is not explained by movements in cap rates. Expected apartment income declines hit their maximum two quarters ahead of the appraisal data, and declines for retail led by one quarter.
With the exception of the pandemic period, this implied expected income growth measure has historically remained relatively in line with MSCI’s measured, historical NOI growth from appraisal data. Zooming in on the levels seen in 2Q2023, though, shows much more optimism about the industrial sector.
Given how investors priced transactions in 2Q2023, expected future income growth stood at 15.6%. High-double-digit income growth for the industrial sector is certainly what the market experienced over the past year, with annual income growth averaging 10.1% per quarter for each of the past four quarters. Deal volume for the industrial sector is performing much better than that of other sectors; strong current and expected income growth implies still-healthy returns moving forward, even if current owners do not move much on cap rate expectations.
Other sectors are not so exciting for investors. The historical income data for office and retail suggest no growth and a below-inflation pace of 1.7% year over year for office and retail, respectively. The current cap rates for deals closing in these sectors make it difficult for investors to achieve some normal level of returns for these sectors at these prices, which helps explain why deal volume is so low. How much would cap rates need to move to bring total returns up to some normal level if this income perspective reflects what the market believes?
Assuming buyers can get what they want from sellers, cap rates would need sizable increases for the retail and office sectors to deliver returns at something like normal total return levels. The apartment sector would require some movement as well but not as much. Knowing that the market is in abnormal territory, would sellers be willing to sell today or hold out for better conditions? The buyers’ perspective alone on where cap rates should move does not make the market.
They Do Not Have to Sell—for Now
Nobody likes to take a loss. That point of human nature explains current commercial property owners’ hesitancy to move. Despite declines in property prices, current income is still at a decent level for most property sectors, and challenges in the debt markets have not yet forced owners’ hands. That debt situation may become an issue in the coming years, however.
Despite concerns about property performance and values, income is now at healthy levels for most property sectors. Looking at same-store trends in NOI from the MSCI US Quarterly Property Index, the initial shocks experienced because of the pandemic are now in the past (Exhibit 3). Investors face a different property income environment now than was present following the global financial crisis.
The retail and residential sectors faced the most NOI challenges in the early stages of the pandemic. Income for the residential sector fell a cumulative 16% from 1Q2020 to 4Q2020. Income for the retail sector fell faster and sharper, a 25% cumulative decline from 1Q2020 to 3Q2020. Facing such sharp declines for property income, owners might have been forced to sell if debt service coverage ratio (DSCR) covenants in loan documentation had been breached. However, the speed with which the CARES Act was passed in 2020 put a floor under household balance sheets and prevented mass distress from the initial income shocks. Property income for both the residential and the retail sectors was effectively back at 1Q2020 levels by mid-year 2022 and at higher levels than the Q1 levels for residential.
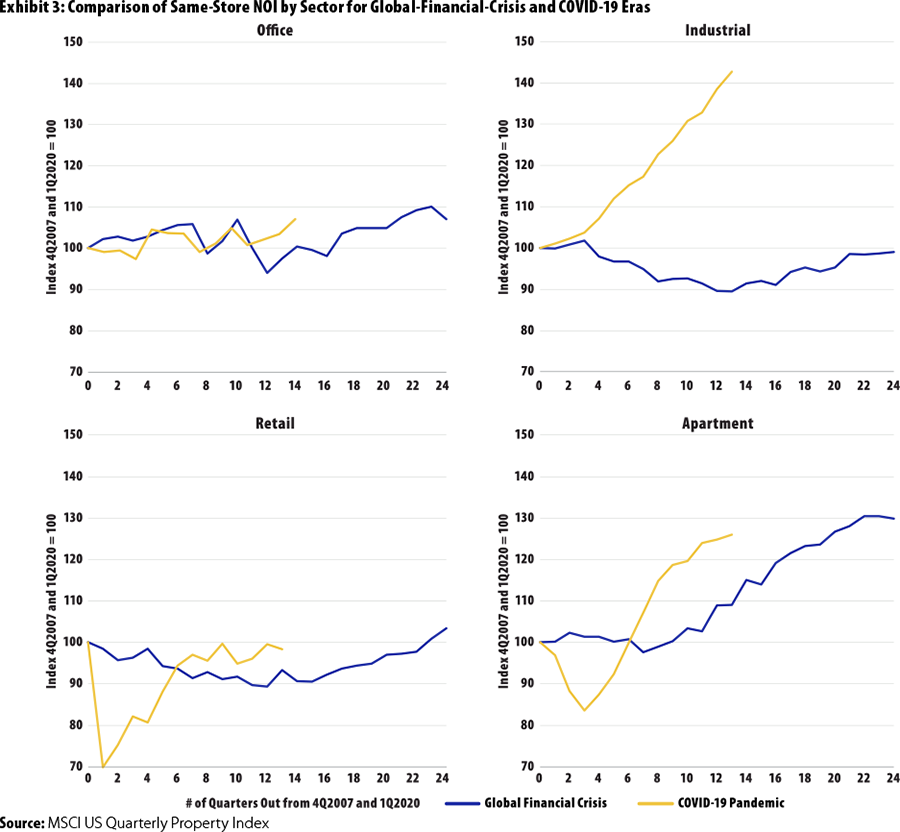
The office sector, by contrast, has seen a steady uptick in property income, though a sample bias may understate the severity of the problem. The MSCI US Quarterly Property Index tends to comprise higher-quality institutional assets, and market commentators have noted tenants’ flight to quality in this market down cycle.1 Quality issues aside, the office sector simply has longer-term contracts in place with tenants. Even though vacancy is rising for these assets, particularly for the CBD office assets, property income has not dropped sharply.
Investors looking for distressed opportunities might point to discussions about the future of offices and highlight the potential for office income to drop in the future. If a bad outcome for property income appears likely for an office property, a current owner will not necessarily sell an asset right away, underwriting that potential bad outcome in the list price. If the property still has cash flow and is within DSCR covenants set up in loan documentation, why should the owner take a loss now? Why not wait and see if property income is actually OK in the future? Loan maturities might force some borrowers’ hands, but timing is a key factor.
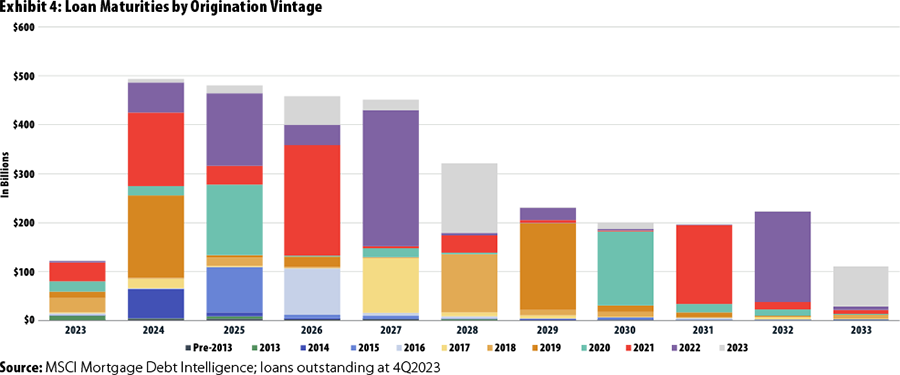
A wave of loans faces maturity through 2027, and these maturity events might force the hands of current owners. MSCI is tracking loans priced at $2.0 trillion in originated values maturing through 2027. If prices drop enough because of the interest rate environment, will current owners be forced to bring in more equity or sell at a loss at these maturity events?
The most problematic loans will be those originated at the record high property prices and record low mortgage rates in 2021 and 2022. In Exhibit 4, these loans are shown in the red and purple colors, respectively. Many loans MSCI tracked from these vintages had five-year loan terms, putting a good chunk of the maturity events off into the future. In 2026, 33% of the 2021 loan originations will mature; in 2027, 37% of the 2022 vintage loans will face maturity. These are the single largest years for maturities of these vintages, but a good number are maturing in 2023 through 2025. The 2021 vintage has 33% of loans maturing through 2025, and the 2022 vintage has 28% maturing by then. In total, 67% of the 2021 vintage loans and 70% of the 2022 vintage will mature by 2027.
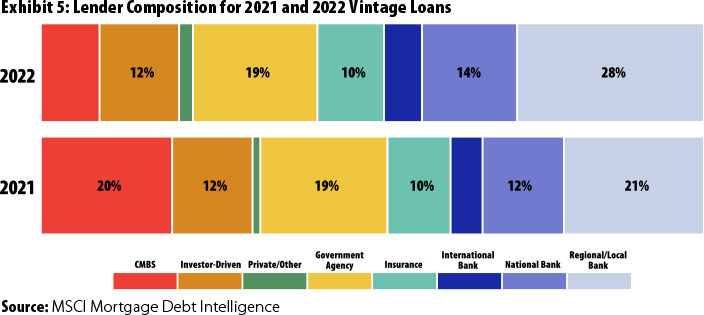
This pace of maturities may drag out distressed events in the market over a number of years. One critical difference between the 2021–2022 loan originations and the loans sold out of distressed situations following the global financial crisis is the nature of the originators. The worst loans following the financial crisis were those packaged for the commercial mortgage-backed securities (CMBS) market. Borrowers of CMBS version 1.0 loans had little leeway when loans went into default or needed to be refinanced. Exhibit 5 shows that the 2021 and 2022 loan vintages were heavily exposed to the banking sector.
Current owners know that potential buyers do not want to pay yesterday’s price for an asset and want to underwrite every worst-case scenario for every deal they face. Potential buyers know that many owners could face refinancing challenges, so waiting might pay off. In many cases, these potential buyers and current owners are the same groups of investors simply holding different assets. For all these groups, the issue of who blinks first is complex and will help explain when a recovery in market liquidity might occur.
The Missing Deals
A piece in this puzzle is missing: many deals are not closing, but there is undocumented information in failed deals. When buyers bid low and sellers do not want to take a loss, market participants know that the market is dislocated—but there is no transaction data to reflect this disconnect. When change happens in the market, potential buyers are quick to reflect this in their willingness to pay for an asset, whereas owners tend to stick to their previous valuations. The gap in the expectation of the price of an asset can be large, and deals are nowhere to be found.
The lack of deal information generates additional uncertainty, which in turn decreases liquidity. Market participants might be pressured to look to the pricing evidence from the REIT market, given the comparatively instant liquidity there, but the pricing for a company will not always be the same as market pricing for an asset.
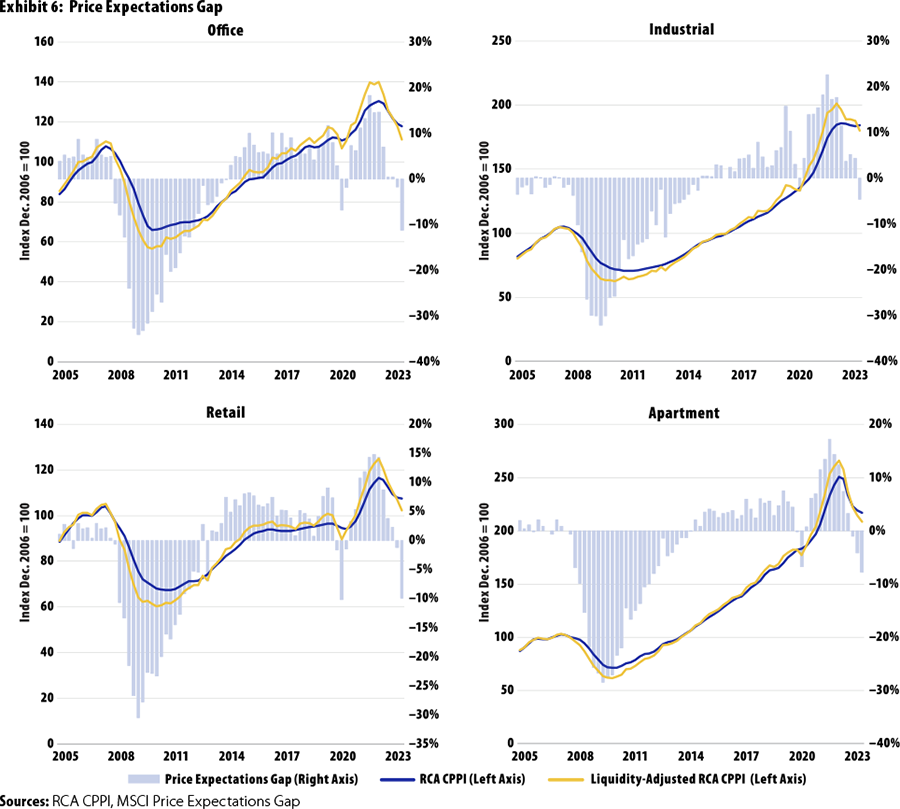
What, then, is the price of a comparatively illiquid commercial real estate asset? When deals are slow, both appraisal values and transaction price indexes suffer from a lack of evidence, and these measures tend to stay at their previous values. The gap in the price expectations between buyers and sellers, however, can be a way to determine where assets would price. The MSCI Price Expectations Gap is drawn from academic research2 and measures this gap in price expectations between buyers and sellers. The larger this gap, the lower the liquidity in the market.
Exhibit 6 shows that the gap in price expectations is the largest for the office market and currently sits at –11.2%. This implies that the gap between buyers and sellers and their expectations of prices is currently 11.2% wider than it is during normal times of liquidity. Another way to think about this measure is to go back to Exhibit 1. This gap shows the price changes needed to bring deal volume for all the sectors below the line up to the normal, long-run level of market liquidity.
If buyers move first and sellers follow, sellers would need to move price expectations by the size of the MSCI Price Expectations Gap to bring that deal volume back to normal levels. The prices in such a scenario can also be calculated. In the office market, prices in the CPPI have declined by 9.7% since 2Q2022. If the price expectations gap is applied and a liquidity-adjusted price index is created, a price decline of 20.6% results since 2Q2022.
The industrial market performs better and has seen a liquidity-adjusted price decline of only 10.5%. These declines are all much larger than those seen in the transaction-based RCA CPPI. In the financial crisis, the liquidity-adjusted price indexes also moved much more quickly and severely than indexes relying solely on transactions in the market.
Closing the Gap
Who capitulates first, buyers or sellers? That question is often posed when market participants discuss the lowered liquidity environment. For buyers to capitulate first and move their price expectations closer to those of sellers, they would need to be convinced that income growth will be higher in the future. Such a scenario seems to be at play in the industrial sector today, but in others, such as office, most participants seem to believe such scenarios are low-probability events.
Current owners may not want to be sellers but might face no other option. Nobody likes to take a loss, but a wave of maturing loans may force their hands.
Note: All RCA data in this article are based on independent reports of properties and portfolios $2.5 million and greater. Data are believed to be accurate but not guaranteed.


