The different property types within the real estate market are all unique and often have their own idiosyncratic challenges and opportunities.

Greg MacKinnon Research Director
PREA
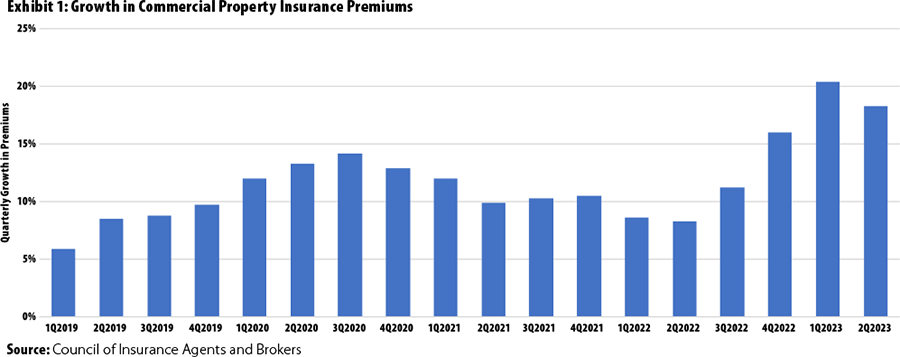
The different property types within the real estate market are all unique and often have their own idiosyncratic challenges and opportunities. One issue that virtually all property owners face is the need to hold insurance on the property to mitigate risk (and often to meet lender requirements). Recently, insurance costs have risen dramatically—in some cases threatening the viability of investment strategies. Exhibit 1 shows quarterly growth rates in premiums for commercial property insurance from the Council of Insurance Agents and Brokers. Premiums have risen steadily and steeply since 2019, with the greatest increases most recently—the three quarters to 2Q2023 showed rate increases in the 15% to 20% range. A recent report from Moody’s Analytics looking at a diverse database of 100,00 properties found insurance costs have increased 7.6% annually since 2017 (compared to typical, historical increases in the 2% to 3% range) on average.1 Although some sectors and locations have had much higher rates of increase, the theme of rising insurance costs has been common to properties across virtually all sectors and locations.
There is no doubt that insurance costs for commercial properties have been rising at a rapid pace, but the numbers in Exhibit 1 and the Moody’s report do not show the extent of the actual effect on institutional portfolios. Although insurance costs have risen for commercial properties overall, many properties are of sizes, in sectors, or in locations that are not attractive to institutional investors. It is not clear whether insurance costs for “institutional-quality” properties have risen at the same rate as commercial properties broadly speaking. Further, asset owners are able, to a certain extent, to react to rising premiums by reducing coverage (to the extent allowed by debt agreements), varying other aspects of their chosen insurance in an attempt to control costs (albeit also exposing owners to increased risk), or even altering the types of properties they hold in their portfolios. The question I address in this article is to what extent institutionally held properties, especially multifamily, is being affected by rising insurance premiums.
To examine how increased insurance costs impact a typical institutional portfolio, I use the database of properties in the NCREIF Property Index (NPI), which holds only institutionally owned properties, and examine trends in reported insurance expenses.


Insurance Costs Rising Across All Property Types–Especially Multifamily
Exhibit 2 shows insurance expenses across all properties in the NPI on a dollar-per-square-foot (per-quarter) basis since the beginning of 2000, along with the rolling fourquarter growth rate in insurance expenses reported for these properties. Note that recent rates of increase in insurance costs were not the highest historically; the greatest increases came in the aftermath of Sept. 11, 2001. However, historically there has been some longterm cyclicity to insurance costs, with periods of rising costs often followed by periods of decreasing costs. In the more current time period, insurance costs seem to have been increasing for an extended period of time, resulting in a significant rise in expenses for property owners. As shown in the exhibit, between the end of 2019 and 2Q2023, average insurance expenses went from $0.06 per square foot per quarter up to $0.12, doubling in three and a half years.
Exhibit 3 shows the rise in insurance expenses from 4Q2019 to 2Q2023 broken down by property type (per square foot and the more standard per unit for multifamily). Increased insurance expenses varied significantly by sector. However, this variation should be kept in context; although office showed the lowest rate of increase in insurance expenses, it is hard to get excited about expenses that rose “only” 80%. All sectors dealt with significantly increased insurance expenses. However, though all properties faced similar pressure, the greatest increases were for multifamily properties, which, as of 2Q2023 on a per-square-foot basis, had the highest insurance costs across the sectors, at an average $0.223 per square foot per quarter—a 136% increase since the end of 2019. Given that multifamily faces especially acute pressure from increasing insurance expenses, I concentrate on that sector in the remainder of this article.


Insurance Expenses Rising for Multifamily Relative to Income
As shown in Exhibit 4, average insurance expenses for multifamily properties in the NPI spiked somewhat following 9/11 but, afterward, fluctuated within a fairly narrow range of $70 to $90 per unit per quarter over the following 18 years. However, insurance costs broke out of that range beginning in late 2019, starting a prolonged and rapid increase to the 2Q2023 level of more than $220 per unit per quarter.
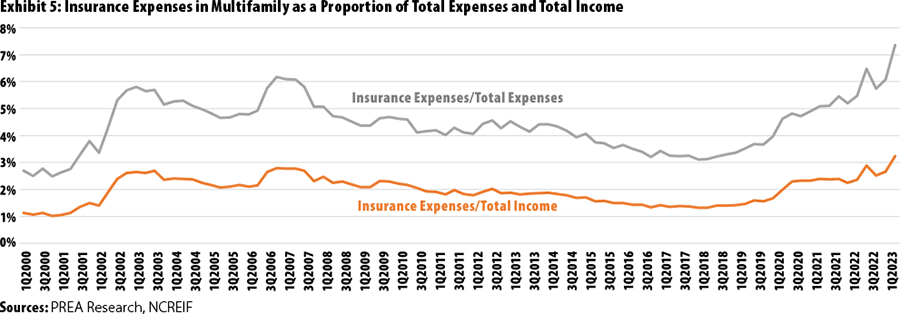
There is no doubt that insurance expenses for owners of multifamily properties increased substantially over the past three and a half years. But understanding the effects of those rising costs requires judging the increases relative to something. If all expenses of owning and managing a multifamily property rise at the same rate, then it is certainly not good for investors, but it means that insurance expenses are not special or different from other expenses and that ownership costs are simply rising, perhaps because of inflation. If rising insurance expenses are offset by rising revenue from the properties, then investors may escape harm by passing on costs to tenants in the form of higher rents. To look at these situations, Exhibit 5 presents insurance expenses for multifamily properties each quarter as a percentage of total expenses and as a percentage of total income.

At the end of 2019, insurance expenses composed only 3.7% of the total expenses of a multifamily property. By mid-2023, this doubled to 7.4%. Insurance costs rose at a much quicker rate than expenses in general and made up a significant portion of the overall expenses involved with operating a multifamily property in 2Q2023. In terms of rising costs, insurance premiums certainly outpaced other costs in the recent past.
A similar pattern is seen when insurance expenses are measured as a percentage of property income—insurance expenses as a percentage of income doubled from 4Q2019 (1.6%) to 2Q2023 (3.2%). Although increased insurance expenses obviously ate into net operating income from multifamily, during much of that time, multifamily experienced a period of very high rent growth, and insurance was still taking up a larger and larger share of income. Going forward, as rent growth slows (or even turns negative in some markets), the increased cost of insurance will become even more worrisome for multifamily owners, especially if the trend of increasing premiums continues.
On average, all the above results are on a national level. But of course, every property is unique. To examine some variations around this national trend in multifamily insurance expenses, I now break down data by property location and type.
Variation by Location, Subsector, and Affordability
Given the role the increasing prevalence of climaterelated disasters plays in the cost of insurance, the locations most prone to disasters would be expected to feel the greatest increase in expenses. To test this, I look at average insurance expenses per unit per quarter across core-based statistical areas (CBSAs) for multifamily properties in the NPI. To ensure comparability over time, I look at only those CBSAs that had at least ten properties in the NPI in both 4Q2019 and 2Q2023. Exhibit 6 shows the cost per unit by CBSA in each time period.

The first thing to note is the huge variation in insurance expenses across metros, ranging from $114 per unit in Minneapolis to $351 in Tampa to a literally off-the-chart $1,316 in San Francisco. Location is obviously a driving factor in insurance costs. All the top ten most expensive metros are in California or Florida, unsurprising given their exposure to natural disasters such as hurricanes, wildfires, and earthquakes. However, the chart also shows that large increases in multifamily insurance expenses were ubiquitous across the country. In fact, some of the largest percentage increases in insurance expenses came in locations that do not typically make headlines for natural disasters. Insurance expenses from 4Q2019 to 2Q2023 increased a remarkable 315% in San Francisco, 251% in Orlando, and more than 200% in Fort Lauderdale, yet the largest increase over the period was actually in Portland, OR, where insurance expenses for multifamily went up 409%. This moved Portland from having the lowest insurance costs in 2019 to being in the middle of the pack in 2023. In North Carolina, Charlotte and Raleigh had increases of 166% and 138%, respectively, while costs in Phoenix rose 132% and in Cambridge, MA, 130%. Although Florida and California remain the most expensive markets for insurance in the country, investors with assets in other regions are not immune and are well advised to keep an eye on insurance expenses and how they might affect investment strategies going forward.

Of course, insurance expenses are not the only thing that varies by metro—typical rent levels also vary greatly by location. If higher insurance costs typically occur in metros with higher average rents, then the net result may even out. Exhibit 7 shows insurance expenses in both 4Q2019 and 2Q2023 as a percentage of total expenses and as a percentage of income across the CBSAs.
San Francisco in 2Q2023 is something of an outlier—insurance expenses took up a remarkable 13.7% of income and accounted for almost one-quarter of total expenses. Other California markets also had insurance as a high proportion of expenses and income, although not to the extent of San Francisco. All the Florida markets with the exception of West Palm Beach had insurance expenses that accounted for 10% or more of total expenses and 5% or more of property income; West Palm Beach ran slightly below, with insurance at 4.3% of income. Though California and Florida again dominated the list as the most expensive insurance markets, others also appear expensive when costs are measured relative to income. Houston multifamily, for example, had insurance expenses that equaled 4.7% of income, putting it just behind Los Angeles and worse than the Riverside, Anaheim, and San Jose CBSAs.
To show how insurance expenses vary with style of property, Exhibit 8 depicts the average insurance expense per unit, insurance as a percentage of total expenses, and insurance as a percentage of income for garden, low-rise, and high-rise properties. Garden apartment properties had the lowest cost per unit of insurance in 2019 and still do in 2023. However, the gap between garden and other sectors of multifamily narrowed; garden properties had the largest percentage rise in insurance expense per unit at more than 200%. Because of this, garden apartments went from having the lowest insurance expenses as a percentage of total expenses or income to having the highest. Garden apartments continue to have the lowest costs of insurance per unit, but the cost increase over the past few years has had the greatest impact on that sector of the multifamily market.

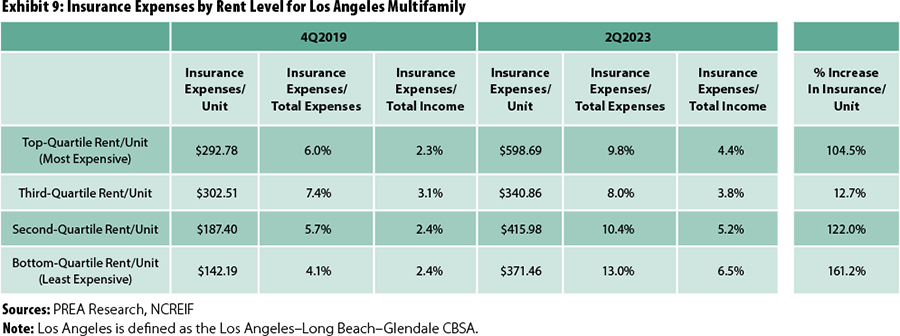
As a final example of how rising insurance costs can affect various parts of the multifamily market differently, I look at properties by rent level to gauge how insurance costs may affect more-affordable properties relative to higher-priced properties. Because rent levels vary by metro, I look at only the Los Angeles CBSA because it had a large number of properties in the NPI database in both 2019 and 2023 and because it had the median percentage increase in insurance costs per unit across the metros (98.7%). In each of 4Q2019 and 2Q2023, I break the multifamily properties in Los Angeles in the NPI into quartiles based on rent per unit, with the bottom quartile having the lowest rent (most affordable) and the top quartile, the highest rent (least affordable). Exhibit 9 shows that in 2019, the most affordable properties had the lowest cost of insurance, but because of the lower rents, insurance as a percentage of income was in line with more-expensive properties. However, by 2Q2023, the lowest-rent-quartile properties had the highest growth rate in insurance costs (161%), and these more-affordable properties had insurance expenses that took up 6.5% of income—higher than for less-affordable properties—and accounted for 13% of total property expenses. More-affordable properties in Los Angeles were hit the hardest by increasing insurance costs. Moving forward, if insurance rates continue to increase, investors looking at the viability of affordable housing strategies and regulators looking to increase the supply of affordable housing will have to pay close attention to how insurance costs may impact economic viability.
Conclusion
In this article, I concentrate on how insurance costs have had the largest impacts on markets in Florida and California, on garden-style multifamily properties, and on the most affordable properties for renters. Still, a key point that deserves to be reiterated is that rising insurance expenses are occurring across all sectors of the multifamily market and, in fact, across all commercial real estate sectors. All real estate investors, no matter their sector or location of interest, should be aware of trends in insurance costs going forward and how they might impact investment strategies.
