Stability and Resilience in Uncertain Times: The Strategic Role of Core Real Estate Debt in Fixed Income Portfolios

Henri Vuong Executive Director
PGIM Real Estate
In the ever-evolving landscape of investment strategies, achieving stability and resilience is crucial, particularly amid market uncertainties and downturns. An intriguing avenue for investors is the incorporation of core real estate debt into their portfolios to enhance fixed income returns while mitigating maximum drawdowns. This article explores the rationale behind including core real estate debt as a valuable asset in fixed income portfolios, particularly through the lens of maximum drawdowns.
Understanding Core Real Estate Debt
Comprehending what core real estate debt entails is essential to understanding its role in portfolio enhancement. Core real estate debt comprises senior secured loans rated at BBB– or better (i.e., investment grade).1 These loans, which can be either fixed or floating, are unleveraged and offer a spread premium to the investment-grade corporate bond market. In the context of commercial real estate, core real estate debt refers to investments in loans secured by high-quality, income-generating properties such as residential complexes, logistics spaces, or office buildings. These loans are typically structured as mortgages or bonds and are considered lower risk because of the stability of the underlying assets.
The Shifting Economic Landscape
With a series of rate hikes in 2022 and 2023, the Federal Reserve increased the target rate to 5.25% to 5.50%; the Fed’s December projections2 indicated a potential easing of rates to 4.6% in 2024—though there are risks to this outlook should economic data points drive the Fed toward a different path. This shift underscores the need for fixed-income investments that can thrive in both rising and falling interest rate environments, as well as in periods of uncertainty—a role well suited for core real estate debt.
Performance and Stability
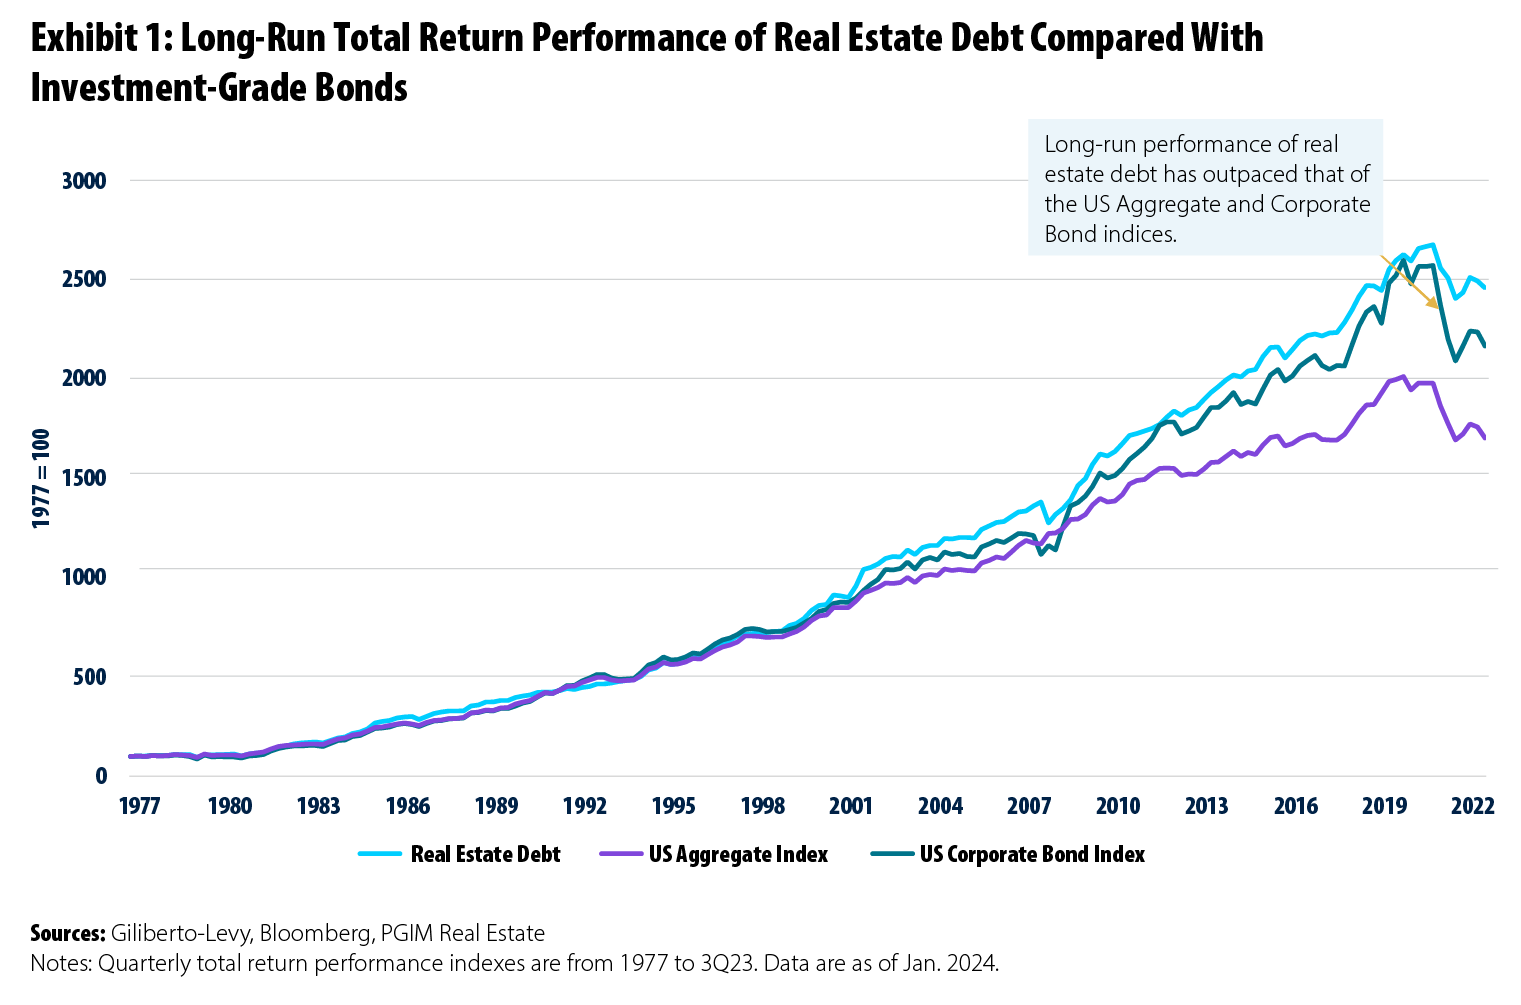
A historical analysis from the first quarter of 1978 to the third quarter of 2023 reveals a compelling narrative for core real estate debt. It outperformed traditional fixed income staples, delivering an annualized return of 7.25% versus 6.39% for the Bloomberg US Aggregate Index3 and 6.95% for the Bloomberg Corporate Bond Index,4 as shown in Exhibit 1. Furthermore, real estate debt’s lower standard deviation of returns (6.27%) compared to the US Aggregate (6.34%) and Corporate Bond (8.07%) indices makes it an appealing choice for investors seeking growth and security. It signals that core real estate debt has the potential to enhance portfolio returns without increasing volatility.

Diversification, Correlation, and the Critical Role of Maximum Drawdowns
Diversification, a fundamental pillar of investment strategy, is further strengthened by the inclusion of core real estate debt. With a correlation of less than 100% when compared to other fixed income assets, real estate debt not only introduces a distinctive risk-return profile but also serves to mitigate overall portfolio volatility. Over the period from the first quarter of 1978 to the third quarter of 2023, core real estate debt returns exhibited a correlation of 82.4% with the US Aggregate Index and 79.6% with the US Corporate Bond Index, thereby offering diversification benefits to a fixed income portfolio. This correlation profile ensures that during periods of volatility in broader bond markets, core real estate debt often acts as a stabilizing force, enhancing portfolio resilience.
The stability of core real estate debt is further underscored by its performance in terms of maximum drawdown (MDD), a key metric that measures the largest percentage decline from an investment’s peak to its trough. MDD is crucial for understanding the downside risk of an investment, allowing investors to gauge potential volatility and risk. It serves as an essential tool for evaluating investment performance by comparing historical downside risks of different investments. An investment exhibiting a lower MDD typically indicates lower historical volatility and smaller losses during downturns.
Moreover, MDD plays a significant role in the recovery dynamics of a portfolio. The larger the drawdown, the greater the gain required to achieve full recovery, underscoring the importance of minimizing drawdowns for a more efficient recovery process. Effective management of drawdowns through diversification strategies and robust risk management techniques can aid in mitigating potential losses during periods of market turmoil.
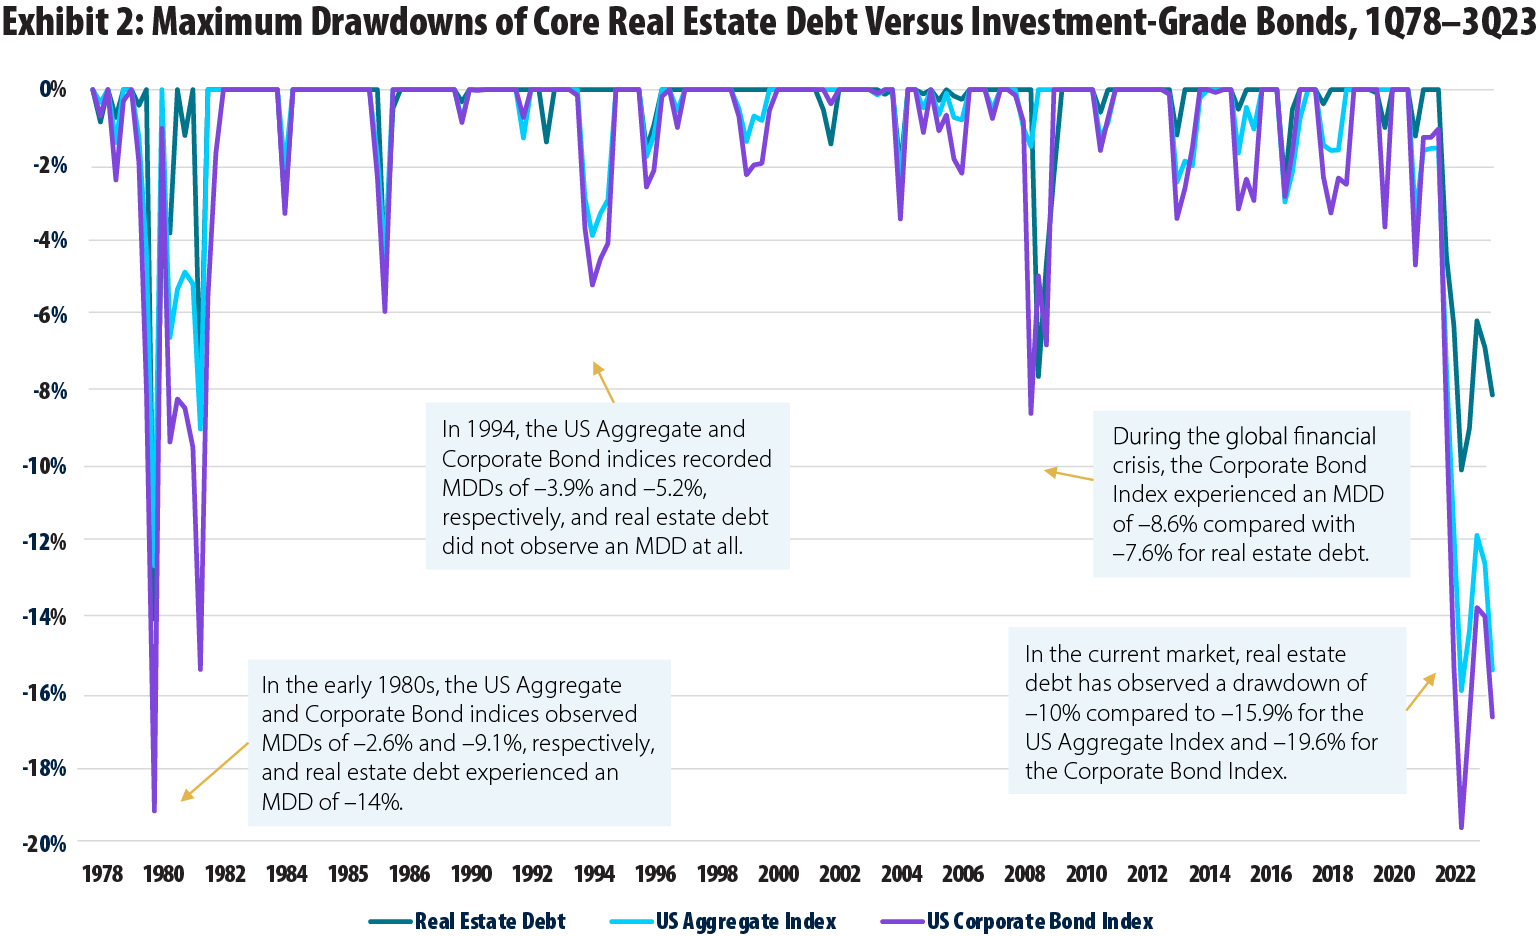
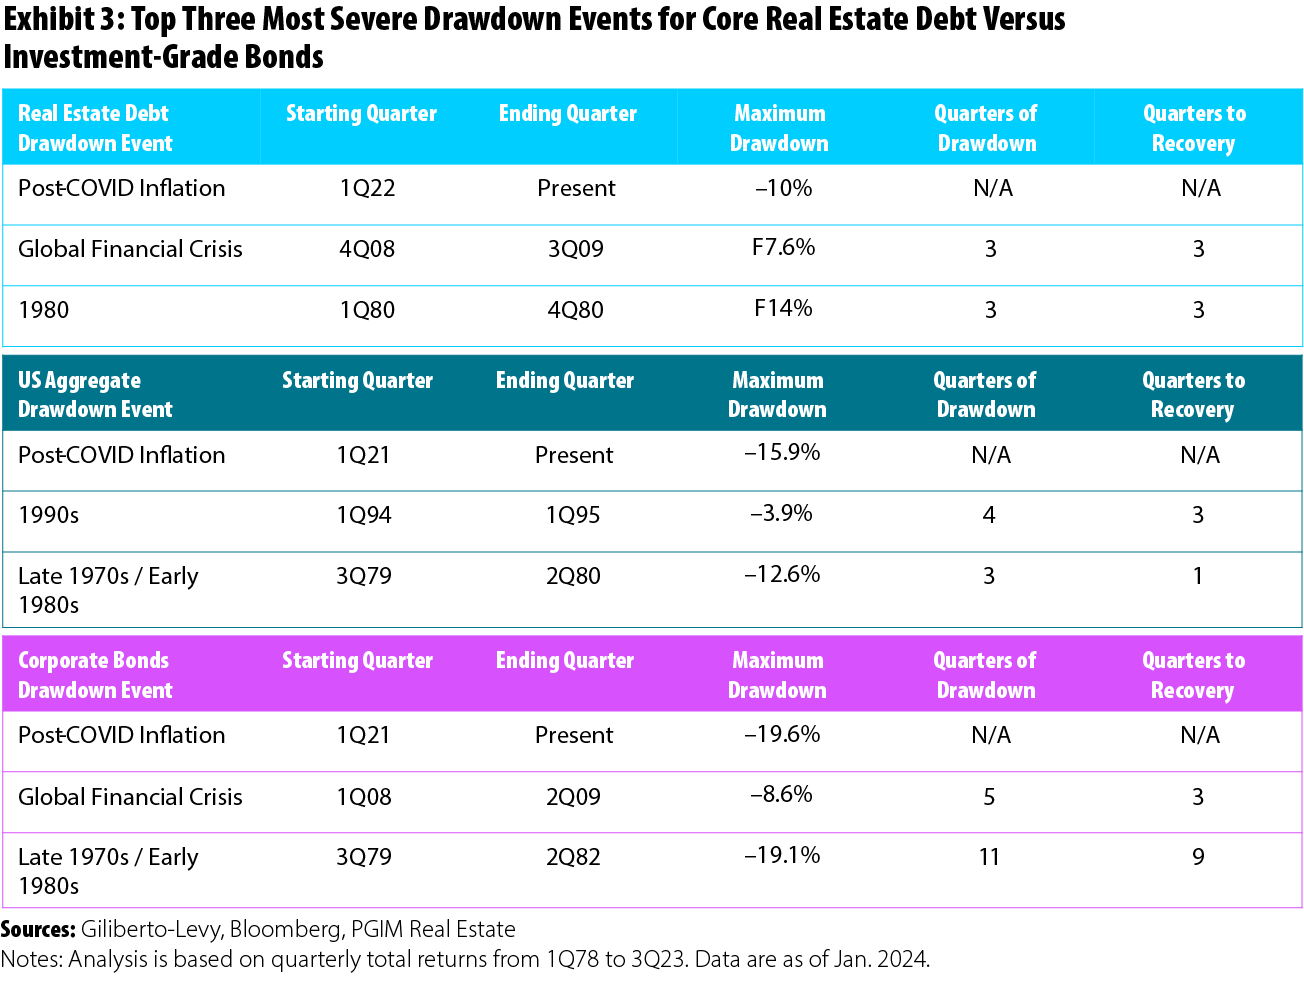
Real estate debt’s history reveals a track record of less frequent and less severe MDDs compared to its counterparts, as shown in Exhibit 2. For example, during the late 1970s and early 1980s, the largest MDD for real estate debt was –14%, significantly lower than the –19.1% experienced by the Corporate Bond Index. Additionally, the recovery from these drawdowns was swifter for real estate debt, taking just three quarters, compared to the nine quarters needed for the Corporate Bond Index to rebound. Notably, during this period, the drawdown events occurred at slightly different times (Exhibit 3), with the Corporate Bond Index drawdown starting in the third quarter of 1979, and real estate debt’s beginning in the first quarter of 1980.
This trend continued during the global financial crisis, with real estate debt experiencing a shallower MDD of –7.6%, commencing in the fourth quarter of 2008. In comparison, the US Corporate Bond Index had an MDD of –8.6% and began its drawdown slightly earlier in the first quarter of 2008. There were also periods when fixed-income assets experienced a drawdown while real estate debt remained unscathed. A notable example is in 1994 when the US Aggregate and Corporate Bond indices recorded MDDs of –3.9% and –5.2%, respectively, while real estate debt did not observe an MDD.
In the current market downturn, core real estate debt further illustrates its robustness, exhibiting a drawdown of –10%, which started during the first quarter of 2022. This contrasts with the –15.9% drawdown for the US Aggregate Index and the –19.6% for the Corporate Bond Index, both of which initiated their drawdowns a year earlier, in the first quarter of 2021. These data points underscore the resilience of core real estate debt and its capacity for quicker recovery periods, which are vital during times of market volatility.


A Strategic Fit for Modern Portfolios
Incorporating core real estate debt into a fixed income portfolio offers a compelling array of benefits. Historical data highlight its capacity for reducing portfolio volatility through lower and less frequent MDDs compared to traditional fixed income assets. Moreover, real estate debt demonstrates quicker recovery from drawdowns, enhancing overall portfolio resilience during turbulent market periods. Additionally, real estate debt has shown the potential for lower downside risk, remaining unaffected during certain drawdown events, while fixed income assets have experienced losses.
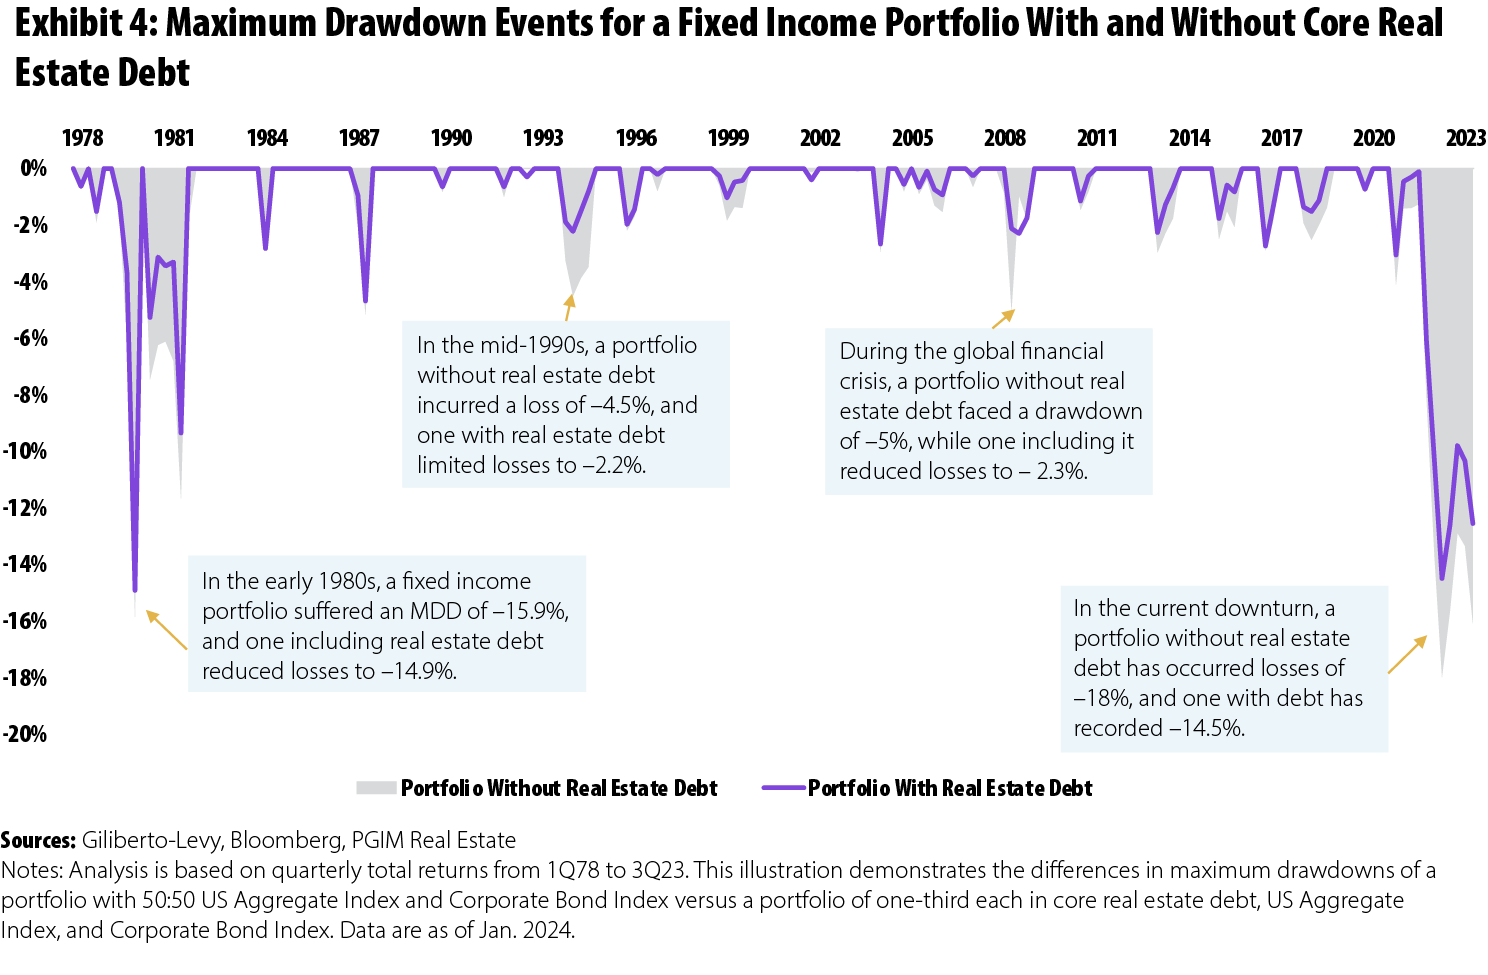
To illustrate these points, consider a hypothetical portfolio comprising the US Aggregate and Corporate Bond indices with and without real estate debt. Exhibit 4 shows how the inclusion of core real estate debt in a fixed income portfolio can mitigate the severity of maximum drawdowns, consequently leading to reduced portfolio losses.
In the early 1980s, a portfolio evenly split between the US Aggregate and Corporate Bond indices suffered a maximum drawdown of –15.9%. Conversely, one that incorporated real estate debt, allocating a third to each category, curtailed losses to a more modest –14.9%. The benefits of this approach became even more evident in the mid-1990s, when a portfolio devoid of real estate debt incurred a loss of –4.5%, while its counterpart with real estate debt in the mix limited losses to –2.2%. Similarly, during the global financial crisis, a portfolio without real estate debt faced a drawdown of –5.0%, while one including it reduced losses substantially to –2.3%.
The most pronounced advantages of integrating real estate debt into a fixed income portfolio are currently unfolding, as evidenced by the ongoing economic downturn, where a portfolio lacking real estate debt has incurred losses amounting to –18%, in contrast to the milder –14.5% experienced by a portfolio with real estate debt. This example demonstrates how the inclusion of core real estate debt has the potential to diminish the impact of MDDs, resulting in more favorable outcomes for a portfolio. As investors navigate the current rate cycle, including core real estate debt in fixed income portfolios becomes increasingly compelling, offering stability, diversification, and enhanced risk-adjusted returns.

Looking Ahead
The role of core real estate debt in a diversified investment portfolio is likely to grow. As economic conditions continue to evolve and interest rates fluctuate, the stability and resilience offered by core real estate debt will become increasingly valuable. Investors that understand and leverage the advantages of this asset class, especially its favorable maximum drawdown characteristics, can better position themselves for both security and growth in the challenging landscape of fixed income investing.
Henri Vuong is Executive Director and Head of Debt Investment Research at PGIM Real Estate.
1. The analysis used throughout this article is based on total returns of private core real estate debt and investment-grade bond indices. Private core real estate debt refers to investment-grade, senior secured, and unleveraged commercial mortgage loans using the Giliberto-Levy (G-L 1) quarterly index for fixed-rate first commercial mortgage loans from 4Q77 to 3Q23. Bonds refer to investment-grade, fixed income indices, the Bloomberg US Aggregate Index and Bloomberg US Corporate Bonds Index using the Bloomberg/Barclays respective quarterly total return indices from 4Q77 to 4Q23.
2. “Summary of Economic Projections,” Board of Governors of the Federal Reserve System, Dec. 13, 2023. https://www.federalreserve.gov/default.htm
3. The Bloomberg US Aggregate Index is a broad-based flagship benchmark that measures the investment-grade, US dollar–denominated, fixed-rate taxable bond market. The index includes Treasuries, government-related and corporate securities, mortgage-backed securities (agency fixed-rate pass-throughs), asset-backed securities, and commercial mortgage-backed securities (agency and non-agency).
4. The Bloomberg US Corporate Bond Index measures the investment-grade, fixed-rate, taxable corporate bond market. It includes US dollar–denominated securities publicly issued by US and non-US industrial, utility, and financial issuers.


